

Vous êtes ici : UFR Simone Veil - santéFRFormation continueMost common echocardiographic views03. Transesophageal echocardiography - the most common views
- Mis à jour le 3 février 2023
- Version PDF
03. Transesophageal echocardiography - the most common views
Long-axis view of the left ventricle
The long-axis view of the left ventricle is close to the transthoracic, apical, four-chamber view. It visualizes the four cardiac chambers, albeit truncating the size of the two ventricles by about 12 to 15%.
Film no. 7 : TEE – long-axis view of the left ventricle.
RV: right ventricle, LV: left ventricle
This view is the equivalent of the apical four-chamber view by the transthoracic route (Film 1). It therefore allows evaluation of the same parameters. However, the right and left ventricular volumes are underestimated by 12 to 15%. The ratio of the ventricular end-diastolic areas is perfectly correlated with the same measurement in the transthoracic view. It is therefore a particularly valuable view when seeking dilatation of the right ventricle in a ventilated patient.
This view can be used to record Doppler flow at the mitral annulus.
RV: right ventricle, LV: left ventricle
From the same view visualized in film 7, the use of pulsed Doppler of the mitral annulus allows recording of the protodiastolic (E wave) and end-diastolic (A wave) velocities of left ventricular filling. The appearance of restrictive flow (roughly, E wave at least twice as fast as A wave) is suggestive of abnormally high pulmonary venous pressure. However, in the end the appearance of the flow contributes little to hemodynamic evaluation of a patient as too many parameters are likely to change it (ventilation, heart rate, for example).
Short-axis view of the left ventricle
The short-axis view of the left ventricle by the transgastric route must pass by the cords of the mitral valve.
It is obtained by pushing the probe in the stomach and then tilting it upwards slightly. As with the transthoracic route, it can be used to evaluate the contractile function of the LV and to visualize any paradoxical movement of the septum. By appropriate positioning of the probe, it is possible to scan the left ventricle from the apex towards the base.
It is obtained by pushing the probe in the stomach and then tilting it upwards slightly. As with the transthoracic route, it can be used to evaluate the contractile function of the LV and to visualize any paradoxical movement of the septum. By appropriate positioning of the probe, it is possible to scan the left ventricle from the apex towards the base.
Film no. 9 : TEE – short-axis view of the left ventricle by the transgastric route.
RV: right ventricle, LV: left ventricle
This view is obtained by pushing the probe in the stomach from the long-axis view (film 7), while tilting it forwards. This gives the equivalent of the parasternal short-axis view by the transthoracic route (film 2). It is important to pass by the cords of the mitral valve and to obtain a left ventricle as spherical as possible. Progressive straightening of the probe allows the left ventricle to be viewed at the level of its most apical segments.
This view is obtained by pushing the probe in the stomach from the long-axis view (film 7), while tilting it forwards. This gives the equivalent of the parasternal short-axis view by the transthoracic route (film 2). It is important to pass by the cords of the mitral valve and to obtain a left ventricle as spherical as possible. Progressive straightening of the probe allows the left ventricle to be viewed at the level of its most apical segments.
By tilting the multiplane probe by 120°, this view unveils the LV outflow tract of the left ventricle, enabling pulsed Doppler for calculation of cardiac flow.
Film no. 10 : TEE – transgastric view of the left ventricle via its LV outflow tract.
LV: left ventricle, Ao: aorta
This view is obtained by turning the multiplane probe by about 120° from the short-axis view of the left ventricle (film 9). By using pulsed Doppler, this allows recording of the ejection flow of the left ventricle just upstream of the sigmoid valves of the aorta. This enables measurement of the area under the flow curve (VTI, time-velocity integral) and of the diameter of the aortic annulus, to calculate the stroke volume of the left ventricle (SV = TVI Pi D2 / 4). This view can therefore be used to assess the efficacy of certain therapeutic interventions in terms of the stroke index of the left ventricle (for example, the effect of a volume expansion).
In certain patients it is possible, again by the transgastric route, to visualize the outflow tract of the right ventricle and the pulmonary artery so as to obtain a Doppler signal.
Film no. 11 : TEE – transgastric view centered on the right ventricle and past its outflow tract
RV: right ventricle, LV: left ventricle, PA: pulmonary artery trunk
This view is obtained from the short-axis curve of the left ventricle (film 9),
by slightly turning the probe so as to center on the right ventricle, then by positioning the multiplane probe between 0 and 90°. This visualizes the outflow tract of the right ventricle as well as the trunk of the pulmonary artery.RV: right ventricle, LV: left ventricle, PA: pulmonary artery trunk
This view is obtained from the short-axis curve of the left ventricle (film 9),
From this view, using pulsed Doppler with the probe positioned upstream of the pulmonary valve, it is possible to assess variations in velocity of right ventricular ejection during ventilation. As with the short-axis parasternal view in TTE (film 5), one can also measure the stroke volume of the right ventricle.
Others views
By withdrawing the probe from the long-axis view while tilting it upwards, it is possible to unveil, among other things the left atrium and the left superior pulmonary vein.
Film no. 12 : TEE – view past the left superior pulmonary vein - LA: left atrium.
This view is obtained from the long-axis view of the left ventricle (film 7) by withdrawing the probe a few centimeters while tilting it forwards. In some patients, improvement can be achieved by turning the multiplane probe a few degrees. The pulsed Doppler probe is positioned 1 to 2 cm before the entry of the vein in the left atrium. Color Doppler mode is useful here, and visualizes an S wave of systolic filling, which is often bi- or even triphasic, a D wave of diastolic filling, and a reverse wave during atrial systole, which is more or less fast and prolonged. The value of this recording is essentially that it detects a typical appearance of high pulmonary venous pressure: small S wave, predominant D wave, reverse, ample and prolonged A wave.
- By continuing to withdraw the probe to about 30 centimeters from the esophageal opening, one obtains an extremely useful view which allows Doppler flow recording in the pulmonary artery downstream of the sigmoid arteries.
- It also unveils the superior vena cava and allows longitudinal-view study (at 90°) of its variations during the respiratory cycle.
- Finally, it visualizes the trunk of the pulmonary artery, the right pulmonary artery, and the beginning of the left pulmonary artery when seeking a thrombus.
Film no. 13 : TEE – view of the vessels at the base of the heart
SVC: Aorta and not superior vena cava, PA: trunk of the pulmonary artery
This view is obtained from the long-axis view of the left ventricle (film 7) by withdrawing the probe a few centimeters while tilting it forwards. This visualizes the aorta transversally as well as the trunk of the pulmonary artery and its bifurcation. By turning the probe a little, the right pulmonary artery can be followed to its lobar bifurcation. The left pulmonary artery cannot be seen or is poorly visible because the left bronchus is interposed. This view visualizes any thrombi in the pulmonary arteries. Using pulsed Doppler with the probe positioned downstream of the pulmonary valve, one can calculate as in film 11, the stroke volume of the right ventricle and its variations during ventilation.
This view is obtained from the long-axis view of the left ventricle (film 7) by withdrawing the probe a few centimeters while tilting it forwards. This visualizes the aorta transversally as well as the trunk of the pulmonary artery and its bifurcation. By turning the probe a little, the right pulmonary artery can be followed to its lobar bifurcation. The left pulmonary artery cannot be seen or is poorly visible because the left bronchus is interposed. This view visualizes any thrombi in the pulmonary arteries. Using pulsed Doppler with the probe positioned downstream of the pulmonary valve, one can calculate as in film 11, the stroke volume of the right ventricle and its variations during ventilation.
SVC: superior vena cava
This view is obtained from the view of the vessels at the base of the heart (film 13).
By centering the image on the superior vena cava in the transversal view and then progressively turning the multiplane probe to about 90°, a longitudinal view of this vein is obtained. Using motion mode, it is then easy to measure the diameter of the superior vena cava at end-expiration and its variations during ventilation. On this film, the patient presented no respiratory variations in the size of the superior vena cava.
Media

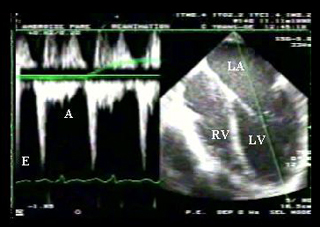


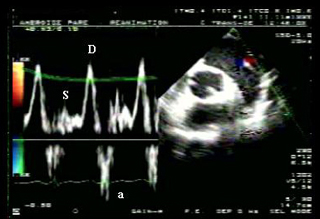

Figure 3 : TEE long-axis view of the left ventricle in a patient ventilated because of cardiogenic acute pulmonary edema related to myocarditis. Pulsed Doppler at the mitral annulus. LV: left ventricle, RV: right ventricle, LA: left atrium. E: rapid protodiastolic filling of the LV. A: end-diastolic filling of the LV (atrial systole). Restricted mitral flow (E/A > 2, deceleration time of the brief E wave) suggestive of high end-diastolic pressure of the left ventricle.
Figure 4 : TEE view passing through the left superior pulmonary vein in the same patient as in figure 3. S: systolic wave, D: diastolic wave. a: retrograde wave concomitant with atrial systole. The reverse view of the flow of left atrial filling (small systolic wave, large diastolic wave), and the presence of a significant A wave, are suggestive of high LV end-diastolic pressure.
Figure 4 : TEE view passing through the left superior pulmonary vein in the same patient as in figure 3. S: systolic wave, D: diastolic wave. a: retrograde wave concomitant with atrial systole. The reverse view of the flow of left atrial filling (small systolic wave, large diastolic wave), and the presence of a significant A wave, are suggestive of high LV end-diastolic pressure.