Vous êtes ici : UFR Simone Veil - santéFRFormation continueCardiorespiratory interactions02. Increased impedance at right ventricular ejection
- Partager cette page :
- Version PDF
02. Increased impedance at right ventricular ejection
Patient mechanically ventilated because of ARDS.
At each inspiration, there is transient dilatation of the right ventricle, reflecting the increase in its afterload.
Patient mechanically ventilated because of ARDS secondary to pneumopathy. PEEP was 5 cmH2O, and plateau pressure was below 30 cmH2O.
At each inspiration, two-dimensional mode coupled to motion mode visualizes dilatation of the right ventricle to the detriment of the left ventricle, which is flattened.
From the pulmonary arterial flow obtained by pulsed Doppler in the trunk of the pulmonary artery, we have developed several indices to evaluate right ventricular afterload during ventilation. These indices can be used to assess tolerance of ventilation, and notably of the PEEP applied.
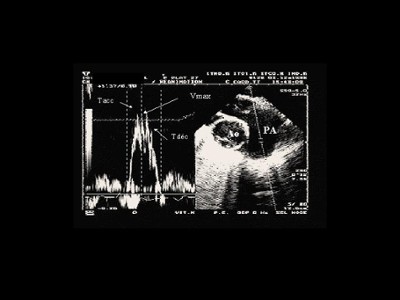
Thus, the mean acceleration of the flow in the pulmonary artery is an index inversely proportional to right ventricular afterload and is directly proportional to the systolic function of the right ventricle. It is calculated as the ratio of the maximum flow velocity over the acceleration time of this flow (time between the start of ejection and peak ejection).
On insufflation, we have demonstrated a drop in mean acceleration at heart beat 3, reflecting an increase in impedance on right ventricular ejection.
Pulsed Doppler in the trunk of the pulmonary artery.
Inspiration causes a drop in maximum velocity of pulmonary artery flow
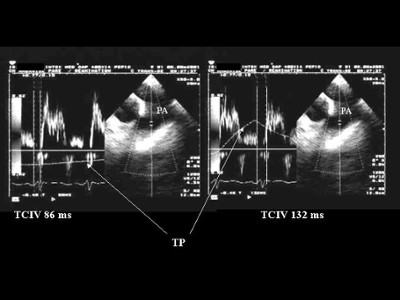
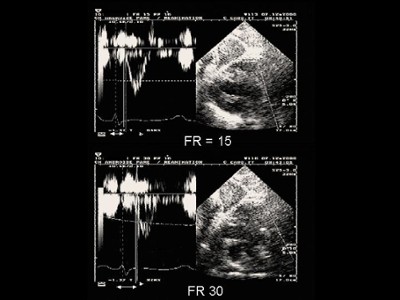
From the Doppler flow in the pulmonary artery, we have also used the isovolumetric contraction time of the right ventricle (from the start of the QRS to the start of ejection). It is directly proportional to right ventricular afterload and corresponds to the pressure of isovolumetric contraction measured beforehand using a pulmonary arterial catheter. Insufflation (Figure 6), as well as a high-frequency ventilatory strategy (Figure 7), can lengthen this Doppler time.
Media
Figure 5 : TEE - View of vessels at the base of the heart. Pulsed Doppler recording of flow in the trunk of the pulmonary artery. Vmax: maximum velocity, Tacc: acceleration time. Vmax (m/s or cm/s) is measured at peak flow; Tacc (ms) is measured between the start and the peak of ejection. The mean acceleration of the right ventricle (m/s-2) is calculated as ratio between Vmax and Tacc.
Figure 6 : TEE - View of vessels at the base of the heart. Pulsed Doppler recording of flow in the trunk of the pulmonary artery. IVCT: isovolumetric contraction time (ms). IVCT is measured between the start of the QRS and the start of right ventricular ejection. On the left, measurement of IVCT at the end of expiration. On the right, its measurement in the same patient, at the end of insufflation, reveals a lengthening which results in an increase in right ventricular afterload.
Figure 7 : TTE - View of vessels at the base of the heart by the subcostal route. Recording of pulmonary arterial flow by pulsed Doppler at the pulmonary annulus. IVCT: isovolumetric contraction time (ms). Measurement of IVCT, in end-expiratory phase, in the same patient at a respiratory frequency (RR) of 15 (above) and 30/min (below). Ventilation at high respiratory frequency lengthens IVCT.


